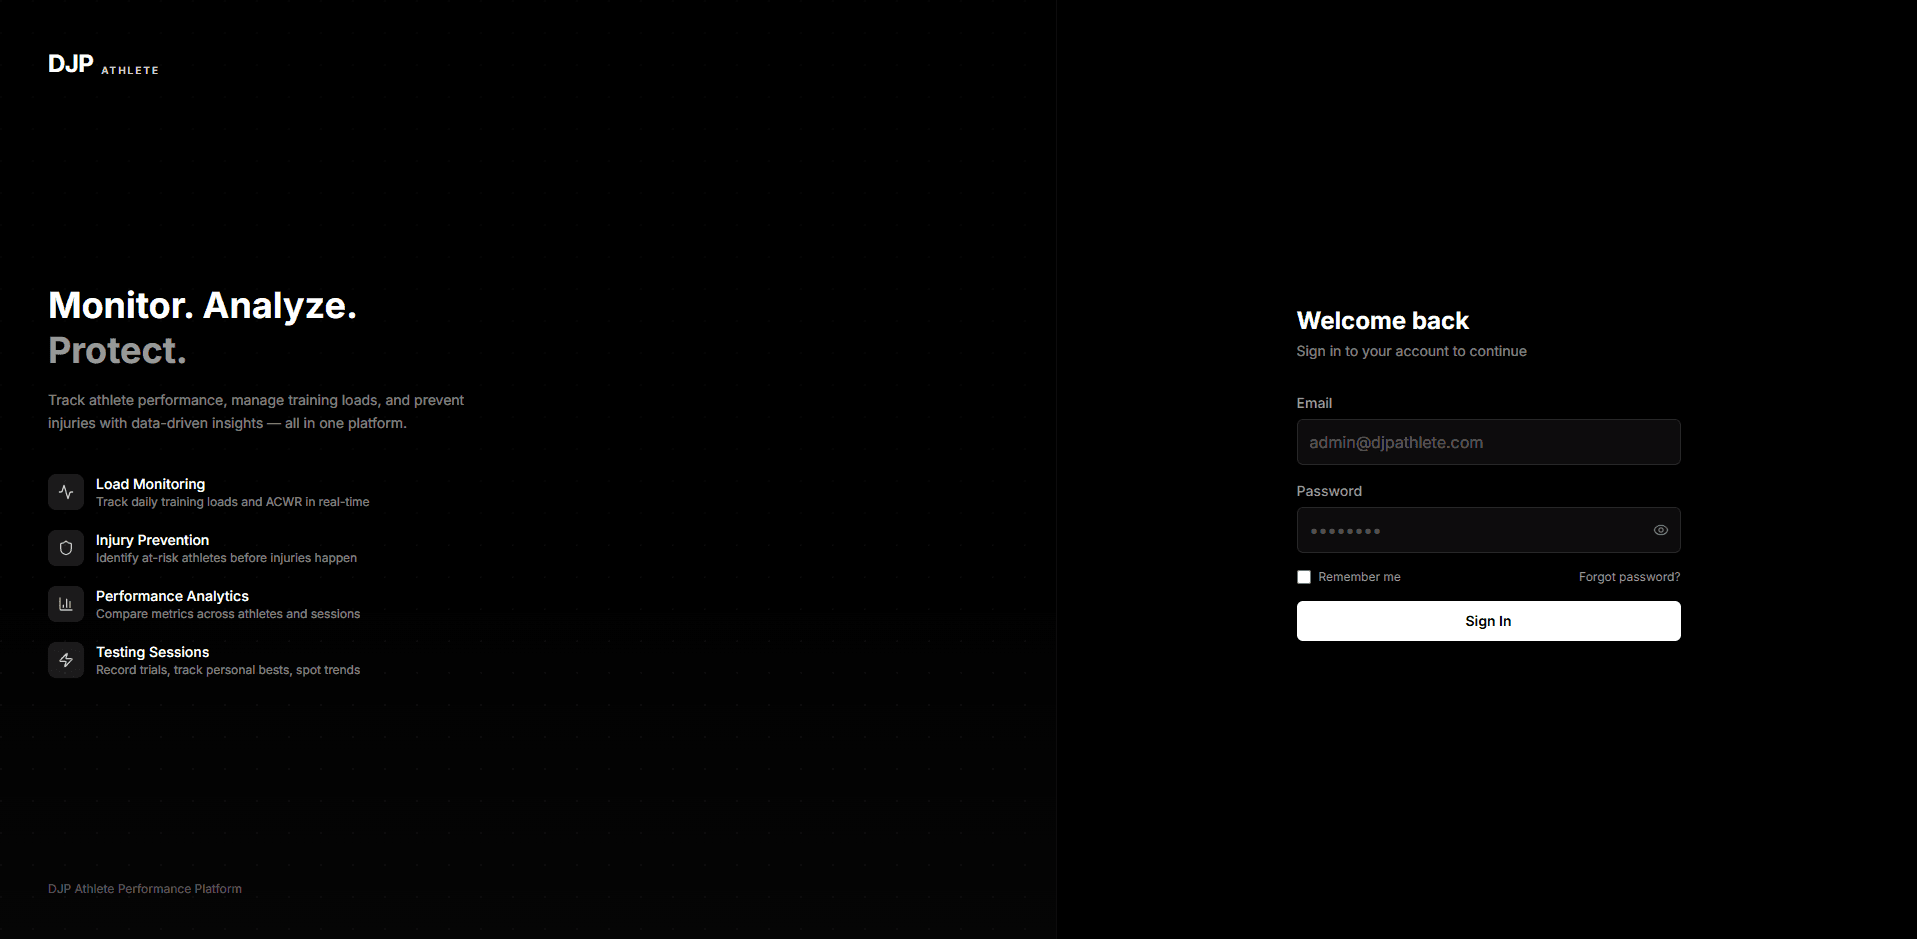
Athlete Performance & Injury Monitoring
A companion analytics platform for tracking athlete performance metrics, injury history, and training load across multiple sports. Features Power BI-style interactive dashboards with drill-down filtering and real-time data exploration.
Tech Stack
The Challenge
Athletes and coaches needed a way to track performance metrics, injury history, and training load across multiple sports with interactive, drill-down analytics comparable to Power BI.
Developed a dual-database architecture using Airtable for data entry and Supabase for analytics queries. Built dynamic, configurable dashboards supporting new sports and metrics without code changes.
Key Features
Dynamic system supporting new sports without code changes
Interactive dashboards with click events and cross-filtering
Dual-database architecture for data entry and analytics
Session-based testing with historical trend analysis